Phase Diagrams, Time-Temperature-Transformation Plots & Continuous Cooling Transformation Diagrams
This section looks at Phase Diagrams, TTT plots and CCT diagrams. These are important in predicting what alloying components will be present in the affected steel, through different cooling rates.
Phase Diagrams
The iron-iron carbide phase diagram is shown to the left. This describes the phases that will be present under equilibrium cooling (or heating) conditions. The phase changes shown in the diagram will only occur if the diffusion controlled atomic movement are given time to take place. Steels are generally restricted to carbon contents below 1.0%.
An interesting phenomenon to discuss is the eutectoid point. This is found at a carbon content of 0.76% at a temperature of 727°C. At this composition, as the steel cools through from austenite (γ) though the temperature of 727°C under equilibrium conditions, the steel will separate into alternating layers of body-centered-cubic ferrite (α) and cementite (Fe3C) according to the eutectoid reaction. This structure is known as pearlite. This process is true also in reverse – in heating pearlite above the eutectoid temperature, the ferrite and cementite will transform into austenite. This is known as austenitisation.

Iron-Iron Carbide Phase Diagram - Callister

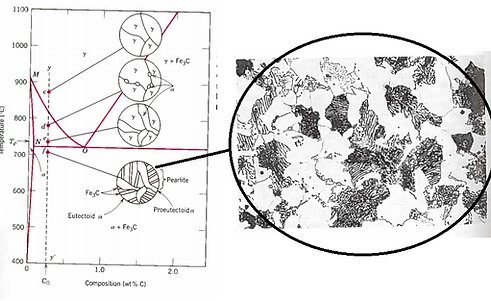
Austenite is a polymorph of iron, in a face centred cubic (FCC) structure. Carbon is relatively soluble in this phase (up to 2% C at 1100°C). It is therefore found in mild carbon steel above the eutectoid temperature of 727°C. As it cools, the austenite transforms into the much less carbon soluble body centred cubic (BCC) polymorph ferrite (α). Ferrite has a carbon solubility limit of 0.02%, the carbon must be displaced and this results in the presence of the carbide cementite (Fe3C). Under micrographic conditions the cementite appears darker than the ferrite and the lamellar structure of pearlite can be observed in the above picture. The pearlitic structure tend to nucleate at austenitic grain boundaries.
If the carbon content of the steel deviates from the eutectoid composition of 0.77%C, the cooling process is more complex. Depending on the exact carbon composition of the alloy, either ferrite or cementite will form at temperatures above 727°C. This additional phase is known as the proeutectoid. Steel with a lower composition of carbon than the eutectoid composition (known as a hypoeutectoid steel) produces proeutectoid ferrite, which can be seen in the above picture. Steels which contain excess carbon (known as hypereutectoid steel) form cementite outwith the pearlite as the proeutectoid.
The steels which are examined in this project are hypoeutectoid, and will therefore produce proeutectoid ferrite similar to the above-right figure in equilibrium conditions. If equilibrium conditions are not met, other types of diagram as mentioned above are required.
Time-Temperature Transformation Plots (T-T-T plots)

Time – temperature – transformation (T-T-T) plots are also known as isothermal transformation diagrams. The sweeping curve going through the centre of the graph opposite is the transformation curve, which describes the extent of material which has changed through to pearlite. Slow transformations which are close to the eutectoid temperature (in the upper right part of the opposite diagram) encourages carbon atoms to spread leisurely – creating thicker formations of lamellar pearlite known as coarse pearlite. Faster transformations inhibit the travel distances of carbon atoms, so a finer pearlite structure is created.
The fundamental underlying principal to isothermal transformation diagrams is the assumption that temperature does not change while a transformation is taking place. The above figure, for example, shows a phase change from austenite eutectic steel through to pearlite over a logarithmic time scale with a constant temperature. This is relevant for isothermal transformations, sometimes used in industry as a means to consistently produce particular steel microstructures, and can be used to approximate the behaviour of extremely slow cooled steels.
When “isothermal” is referred to in this case, it is referring to the temperature that the transformation actually takes place at. A specimen can be quenched to a certain temperature (such as 620°C in Figure 5) then held at that temperature as the austenitic transformation takes place. This is often with the use of a salt bath to ensure consistency.
Although these diagrams rely on a constant transformation temperature, and so are not applicable when describing quenched steels that are being examined in this project (and the slow cool conditions are well explained by equilibrium Phase Diagrams), they can be used as a rough guide as to what behaviour can be observed. And they do indeed have a use in predicting and obtaining certain compositions of alloying components, they are not extremely useful in this case. Further diagrams that explain cooling rates in real engineering terms are required.
Continuous Cooling Transformation Diagrams (CCT's)

Continuous cooling transformation (CCT) diagrams explain the effect of rate of cooling. In the figure to the left, this is illustrated with the dotted curved lines. Continuous cooling curves represent what happens in actual practise when an engineering component is cooled from the austenitic region. The microstructure will differ with the rate of cooling: if the rate of cooling falls below the critical rate and falls to the left of the line, the majority of the microstructure will consist of martensite (See Mech. Properties of Iron-carbon alloys). If the cooling rate is to the right, the structure will be pearlite. If the cooling rate exists in or passes through these dotted lines, a combination of pearlite and martensite will be produced.
With these various graphs, predictions can be made as to what the microstructure of the steel will look like. CCT diagrams are more applicable to quenched steels - if the cooling rate is faster than the critical cooling rate, then martensite is expected to form.
More details can be found in the report.